Hydrograph is a term used in the field of hydrology to describe the graphical representation of a river’s flow over a period of time. It is a useful tool that provides information on the behavior of a river, including the magnitude, timing, and duration of the flow.
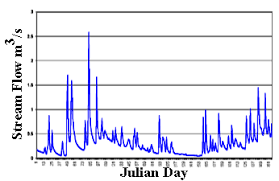
Hydrographs are typically plotted with time on the x-axis and discharge or flow rate on the y-axis. The flow rate is typically measured in cubic meters per second (m3/s) or cubic feet per second (cfs). The shape of a hydrograph can provide insights into a river’s behavior and the impact of various factors on its flow.
Hydrographs are commonly used in water resources management to monitor and forecast river flows. They are also used in flood forecasting and early warning systems, which can help to mitigate the risk of flooding and minimize the damage caused by floods.
The analysis of hydrographs can provide valuable information on the water cycle and how it affects the natural environment. For example, a hydrograph can help determine the impact of climate change on river flows, which can inform decision-making on water resources management.
Hydrographs are also used in the design of hydraulic structures, such as dams and bridges. The analysis of hydrographs can provide important information on the maximum flow rate that a structure may need to accommodate, helping to ensure that it is built to withstand extreme weather events.
In conclusion, hydrographs are an important tool in the field of hydrology, providing valuable insights into river behavior and informing decision-making in water resources management. Their use in flood forecasting, early warning systems, and the design of hydraulic structures highlights their importance in ensuring the safety and sustainability of our water resources.
Important Links