The Lorenz Curve is a powerful tool used in economics to analyze income distribution within a society. Developed by American economist Max O. Lorenz in 1905, this graphical representation provides valuable insights into income inequality and wealth disparities. In this article, we will discuss the concept of the Lorenz Curve, its construction, interpretation, and its significance in assessing societal economic conditions.
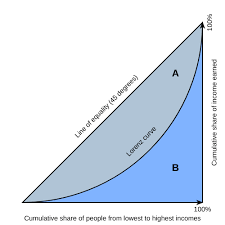
Table of Contents
What is Lorenz Curve?
It is a graphical representation that compares the cumulative distribution of income or wealth with the ideal of perfect equality. It plots the cumulative percentage of income or wealth held by the population on the horizontal axis against the cumulative percentage of the population on the vertical axis.
Construction of the Curve
To construct the curve, data on the income or wealth distribution within a society is required. The population is divided into income or wealth brackets, and the cumulative percentage of the population is calculated for each bracket. Similarly, the cumulative percentage of income or wealth held by each bracket is determined. These values are then plotted on the graph, and the points are connected to form the curve.
Interpretation
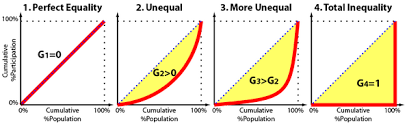
The curve provides a visual representation of income or wealth inequality. The closer the curve is to the line of perfect equality (the diagonal line connecting the origin and the point of maximum income or wealth), the more equitable the distribution. Conversely, the farther the Lorenz Curve deviates from the line of perfect equality, the greater the income or wealth disparity within the society.
Gini Coefficient and the Lorenz Curve
The Gini coefficient is a numerical measure derived from the Lorenz Curve. It quantifies the extent of income or wealth inequality within a society. The Gini coefficient ranges from 0 to 1, with 0 representing perfect equality and 1 indicating maximum inequality. The Gini coefficient can be calculated by dividing the area between the curve and the line of perfect equality by the total area under the line of perfect equality.
Significance and Policy Implications
The curve and the associated Gini coefficient offer policymakers and researchers valuable insights into income and wealth disparities. By analyzing the shape and position of the curve, policymakers can gauge the effectiveness of income redistribution policies and identify areas where intervention may be necessary. It also serves as a benchmark for assessing the impact of economic policies on income inequality over time.
Important Links