The load curve is a graphical representation showing the variation of load with time in a power system.
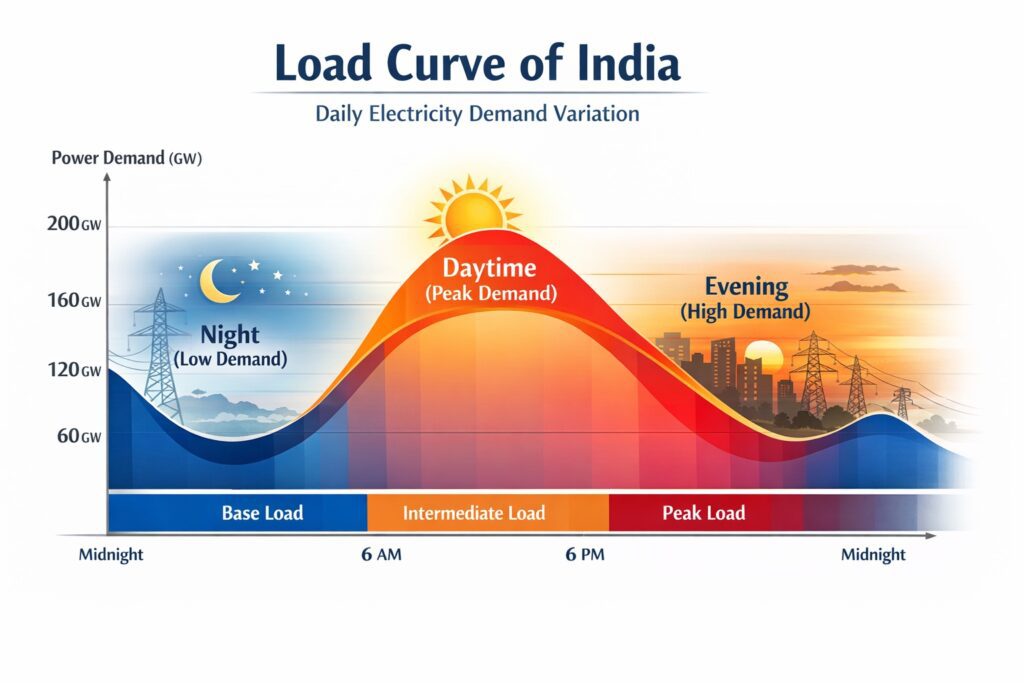
Table of Contents
Definition
A load curve is a plot of load (kW or MW) versus time (hours, days, or months).
Types of Load Curves
Daily Load Curve
- Variation over 24 hours
- Shows peak and off-peak demand
Weekly Load Curve
- Variation over a week
- Shows weekday and weekend trends
Monthly Load Curve
- Used for short-term planning
Annual Load Curve
- Used for long-term planning
Key Features
Maximum Demand
Highest load during a period
Base Load
Minimum continuous load
Peak Load
Highest short-duration load
Average Load
\[
\text{Average Load} = \frac{\text{Total Energy}}{\text{Time}}
\]
Importance
- Power plant scheduling
- Economic operation
- Capacity planning
- Load management
Load Duration Curve
Load duration curve is obtained by arranging load values in descending order.
- Not time-based
- Used for economic analysis
Applications
- Generation planning
- Tariff design
- Load forecasting
- Reliability studies
Example
- Morning load increases
- Evening peak
- Night load decreases
Important Points
- Load curve = Load vs Time
- Used to find maximum demand and load factor
- LDC is sorted form of load curve
Conclusion
Load curve helps in understanding demand variation and ensures efficient and economical power system operation.